Child Poverty
Updated February 2024 with new figures from Child Poverty Action Group and Greater Manchester Poverty Action
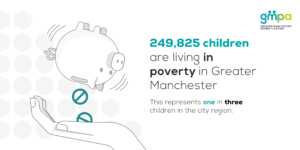

Around 250,000 children are living in poverty (after housing costs) in Greater Manchester. The child poverty rate in the city region is higher than the England and UK average.
This page details the child poverty rate (after housing costs) in each Greater Manchester local authority and presents a map detailing constituency level child poverty figures. As the government doesn’t produce local level working age and pensioner poverty figures, child poverty is often used as a proxy for poverty rates more broadly within an area.
Want the latest poverty information, data, stories and news delivered straight to your inbox? Sign up to our fortnightly newsletter.
Child poverty rates by local authority
This chart shows the proportion of children living in poverty after housing costs in each of Greater Manchester’s ten boroughs in 2021/22.
In 2021/22, Manchester had the highest level of child poverty (44.7%) and Trafford had the lowest level of child poverty (22.3%).
The chart also allows you to look at child poverty rates over time. There has been an upward trend in all Greater Manchester boroughs from 2014/15 to 2021/22, apart from in Trafford. Oldham has seen the biggest increase with a percentage point rise of 11.1%.
The figures in this chart compare with a UK wide child poverty rate of 29% in 2021/22.
Child poverty rates by constituency
The map below shows the percentage of children in poverty after housing costs by constituencies in Greater Manchester. The highest rates of child poverty can be found in Oldham West and Royton (51.3%), Bolton South East (50.9%), and Manchester, Gorton (50.8%).
Altrincham and Sale West has the lowest rate of child poverty at 13.3%.
Of Greater Manchester’s 27 constituencies, 23 have a child poverty rate of 30% or above.
Two-child limit
The map below shows the percentage of children living in households affected by the two-child limit in each constituency in Greater Manchester. This is highest in Blackley and Broughton (32%), Bolton South East (23%), Manchester Central (22%), Manchester, Gorton (22%) and Oldham West and Royton (20%).
Altrincham and Sale West has the lowest percentage at 3%.
The percentage of children affected by the two-child limit is higher than the national average for England (11%) in 17 of Greater Manchester’s 27 constituencies.
The chart below shows the percentage of children living in households affected by the two-child limit in each local authority in Greater Manchester. This is highest in Manchester (20%), Salford (20%) and Oldham (18%).
Trafford has the lowest percentage at 6%.
The percentage of children affected by the two-child limit is higher than the national average for England (11%) in seven of Greater Manchester’s 10 local authorities.
To download the full data for all North West local authorities and constituencies, click here.
Free School Meals
Children in poverty not eligible for free school meals by local authority
Using administrative education data and local poverty estimates, this chart shows the breakdown, by local authority (LA), of children in poverty not eligible for free school meals (FSM). The analysis shows that every Greater Manchester LA has thousands of children in poverty who miss out, ranging from 3,000 in Bury and Stockport to 10,500 in Manchester.
Estimates of Free School Meal eligibility by ward
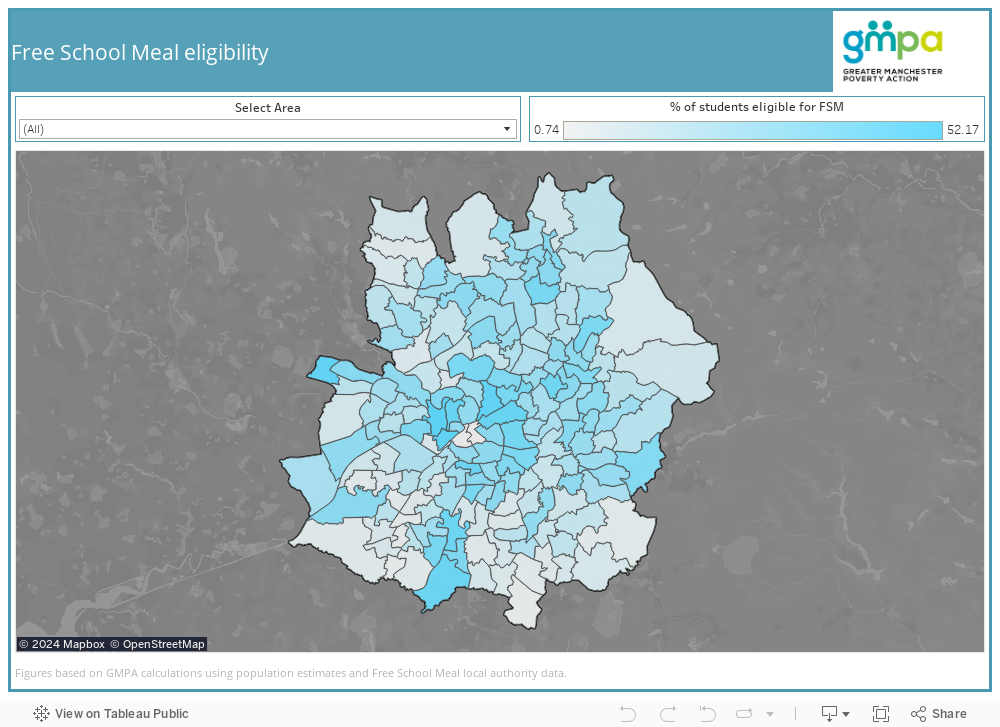
This map shows estimates of the percentage of students eligible for Free School Meal (FSM) by ward across eight out of ten Greater Manchester boroughs (comparable data for Bolton and Wigan wasn’t available at the time of publication). FSM eligibility is often used as a proxy for measuring child poverty and gives an insight into the number of families eligible for support in an area.
The darker the area on the map the higher the proportion of children eligible for FSM. Hovering over an area with your cursor allows you to see the FSM eligibility rate for that ward.
These estimates were made by GMPA using ONS population estimates and data provided by local authorities showing the number of pupils eligible for FSM in each ward.
 Free School Meals eligibility rates by local authority

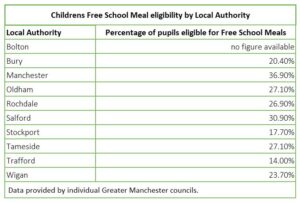
This table shows the proportion of pupils in each Greater Manchester borough eligible for Free School Meals. Free School Meal eligibility is often used to understand the number of school pupils living in low income households in a locality, and can be used to complement the child poverty data presented above.
Manchester has the highest proportion of pupils eligible for Free School Meals (36.9%) and Trafford the lowest (14%). Please note that we were unable to obtain figures from Bolton.
You can find out more about Free School Meal eligibility here.
Please click here to return to the GM Poverty Monitor 2022 main page and the list of sub pages
Poverty Monitor 2022: Child Poverty