
Education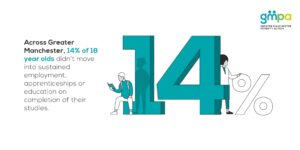
Educational attainment is a major factor in determining a person’s risk of poverty. In Greater Manchester, there is variation across the city region at each stage of educational development. This page includes education data relating to key developmental stages in a person’s educational journey. The page also includes information relating to digital exclusion. We have included this indicator under the education theme given the increasing importance of this issue to educational development and attainment, whilst acknowledging that digital exclusion has consequences beyond these.
Want the latest poverty information, data, stories and news delivered straight to your inbox? Sign up to our fortnightly newsletter.
Educational attainment
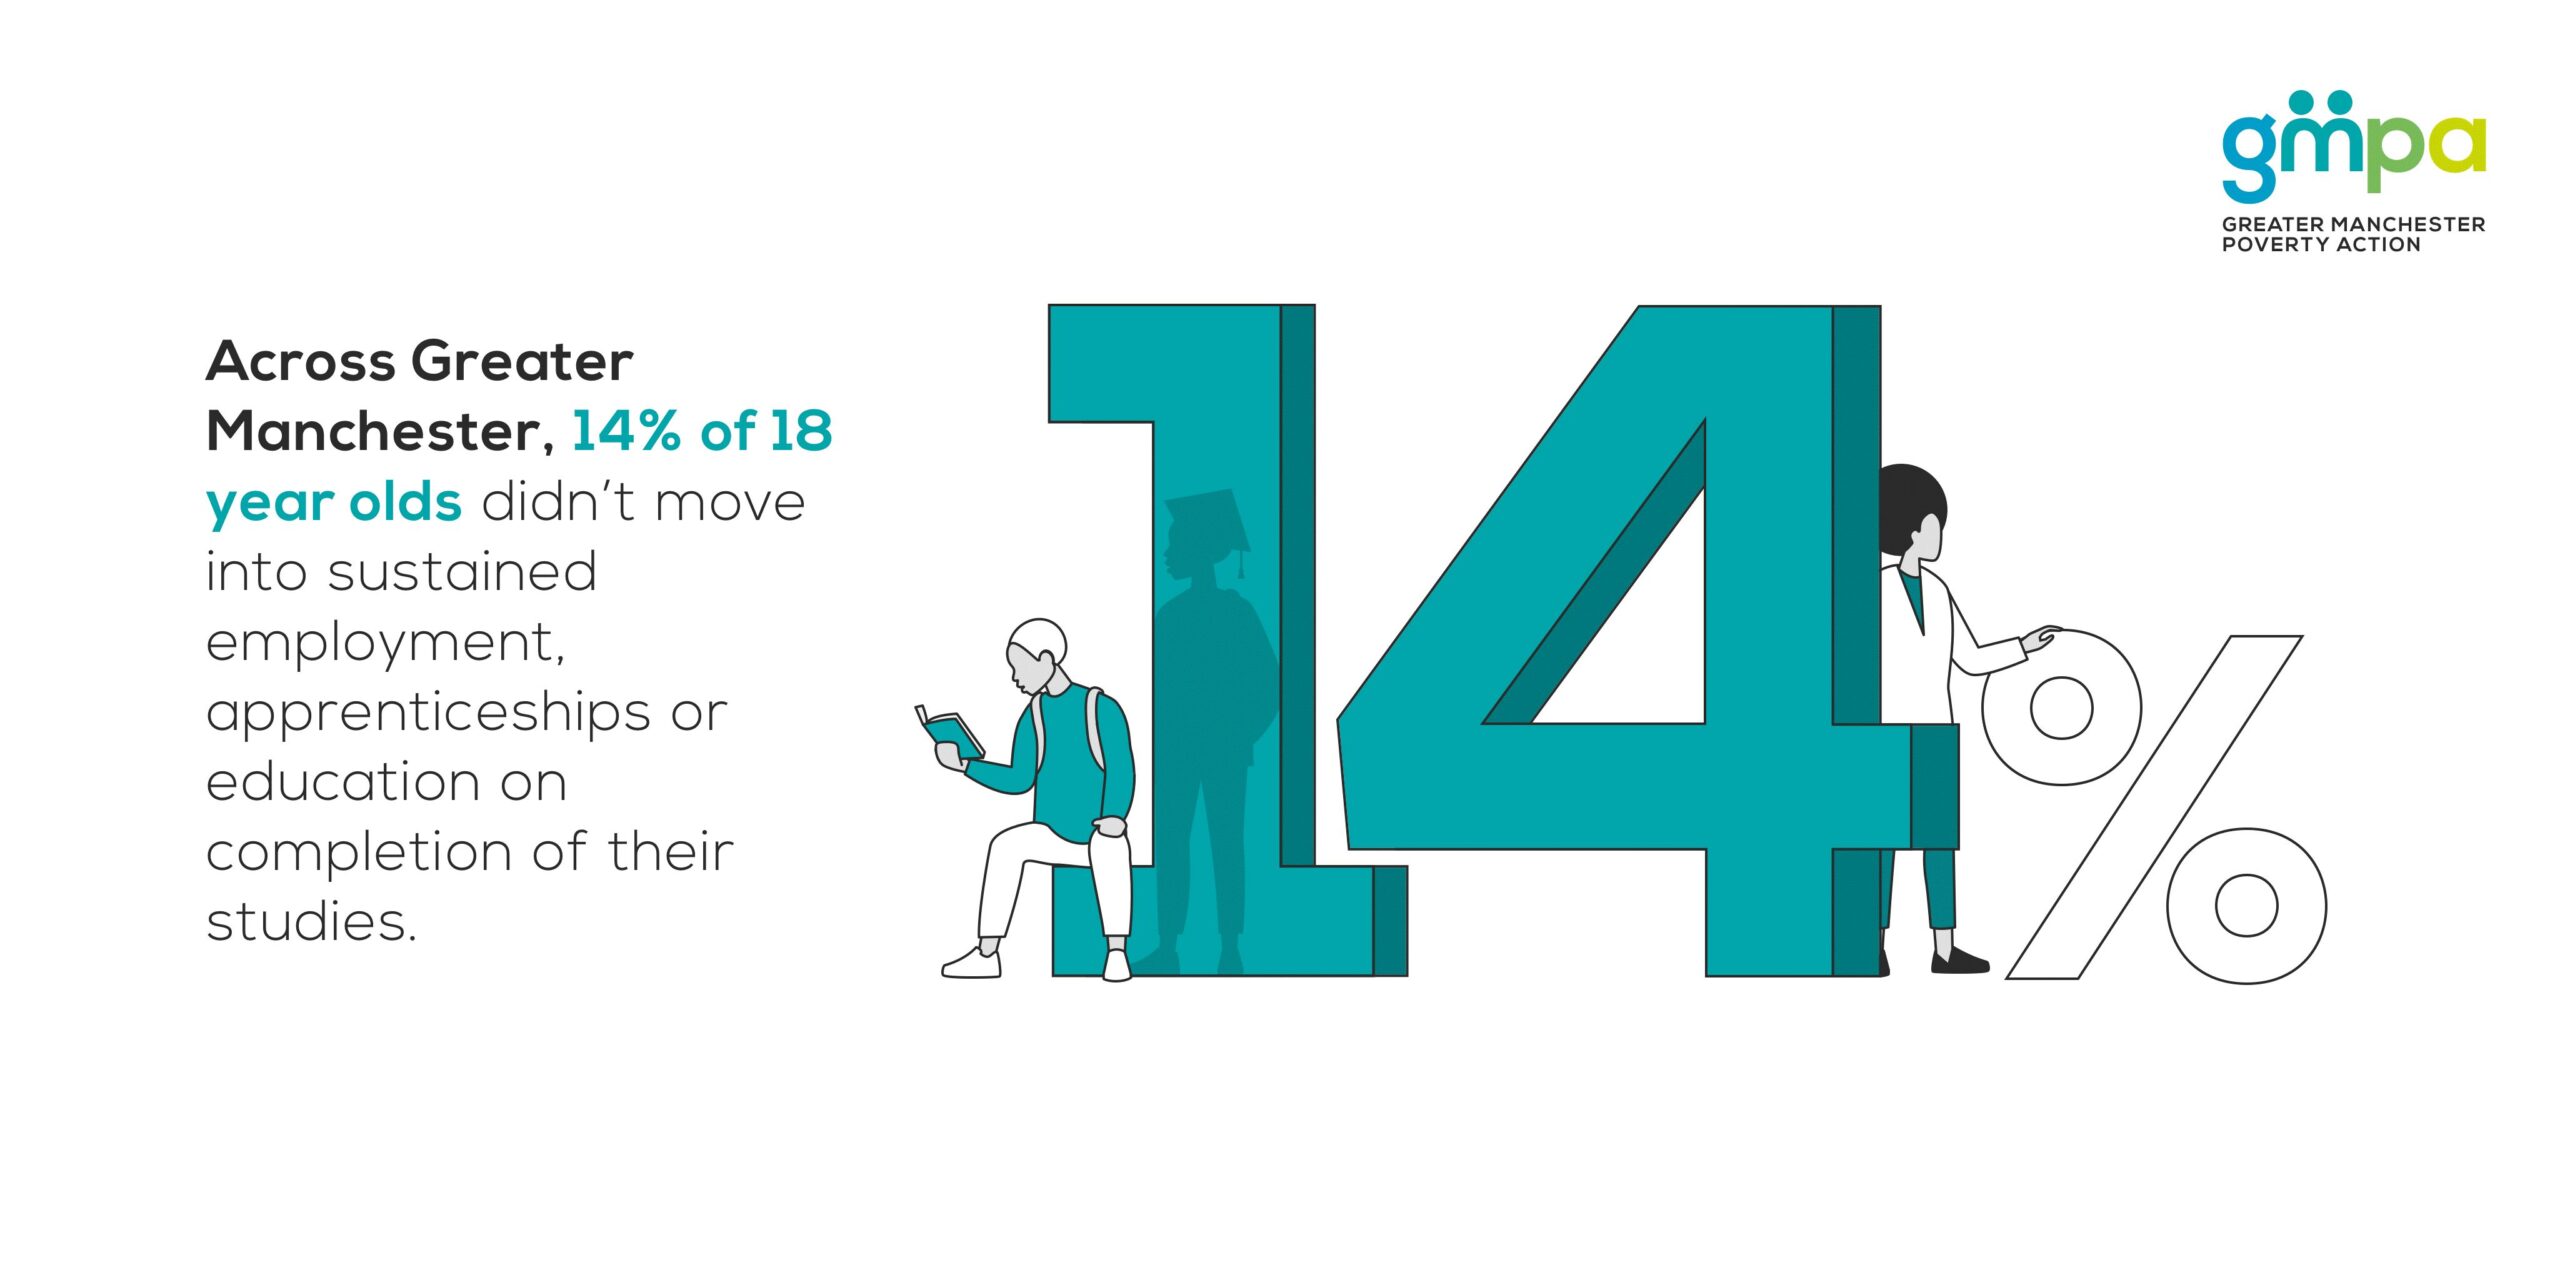
The chart below shows the Attainment 8 score in each of Greater Manchester’s ten boroughs plotted against the average score for England. Attainment 8 measures the achievement of a pupil across 8 qualifications that seeks to capture the progress a pupil makes from the end of primary school to the end of secondary school.
Attainment 8 scores vary significantly across the ten boroughs. Only two boroughs, Trafford and Stockport, had a score higher than the England average in 2020/21.
Data for previous years (2018/19 and 2019/20) can also be viewed on the chart. The Attainment 8 score across Greater Manchester’s ten boroughs was higher in 2020/21 compared to the two previous years, replicating the England-wide trend.
Qualification levels
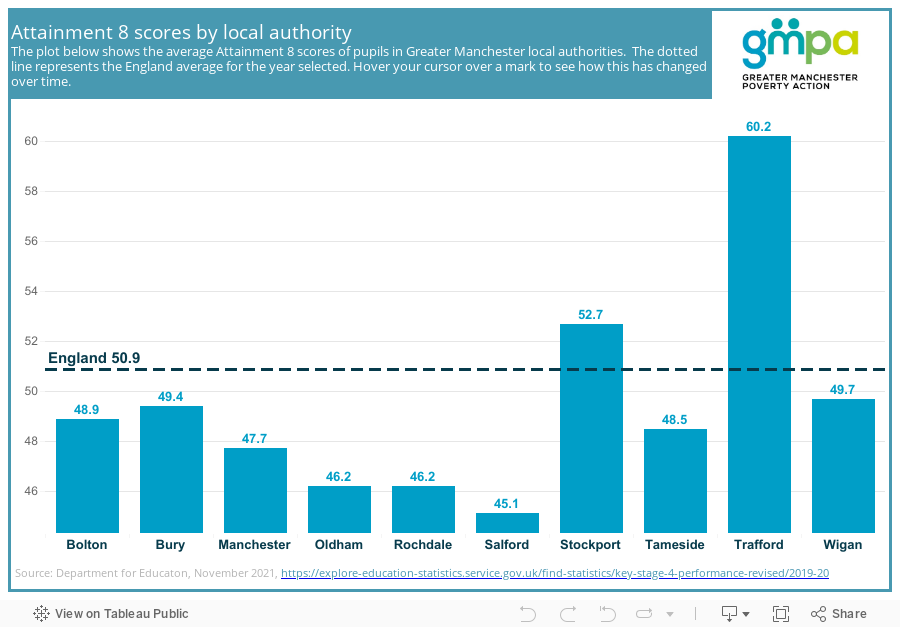
This chart shows the qualification level across England, the North West, Greater Manchester and each of Greater Manchester’s ten boroughs. This data shows disparities across Greater Manchester.
A similar proportion of people in five of Greater Manchester’s ten boroughs (Bury, Manchester, Salford, Stockport and Trafford) have achieved a highest educational qualification level of NVQ4 compared to the England-wide figure (43%).
In addition to the data illustrated in this chart, users can download more granular educational attainment data for the population of each Greater Manchester borough by downloading this spreadsheet. Please note that this data has been sourced separately and may not tally with the figures illustrated in the chart.
Destinations
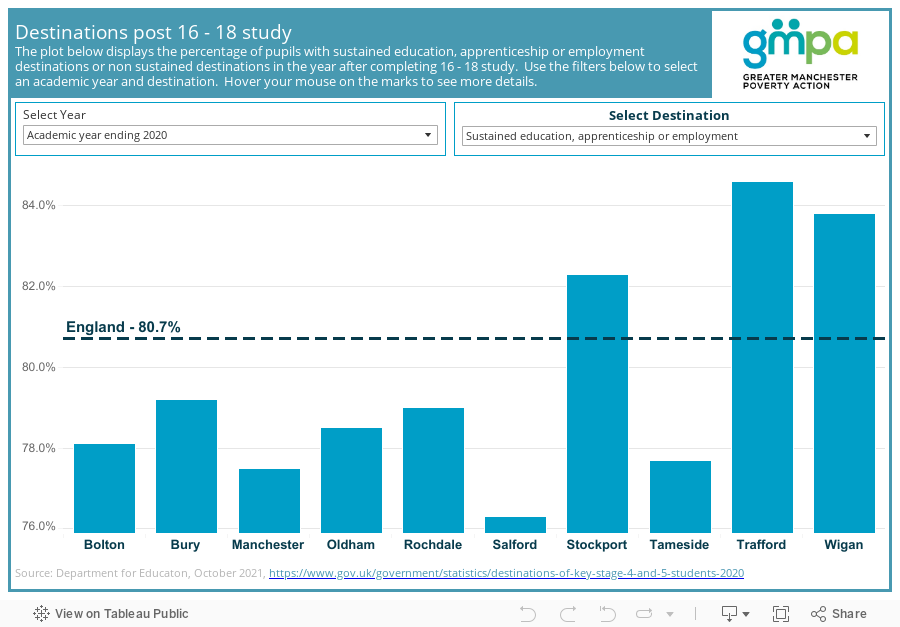
This chart shows the destination of young people once they have completed their aged 16 to 18 studies.
In 2020, a higher proportion of young people in Stockport (82.3%), Trafford (84.6%) and Wigan (83.8%) go into sustained education, apprenticeship or employment compared to the England average. In the remaining seven boroughs, in 2020 a higher proportion of young people didn’t enter a sustained educational, apprenticeship or employment destination compared to the England average.
Among Greater Manchester’s ten boroughs, Stockport (25.9%) had the highest proportion of young people moving into sustained employment in 2020. Stockport also had the highest rate (13.2%) of young people moving in sustained apprenticeships in 2020, whilst Trafford (57.2%) had the highest proportion moving into sustained education.
Digital exclusion
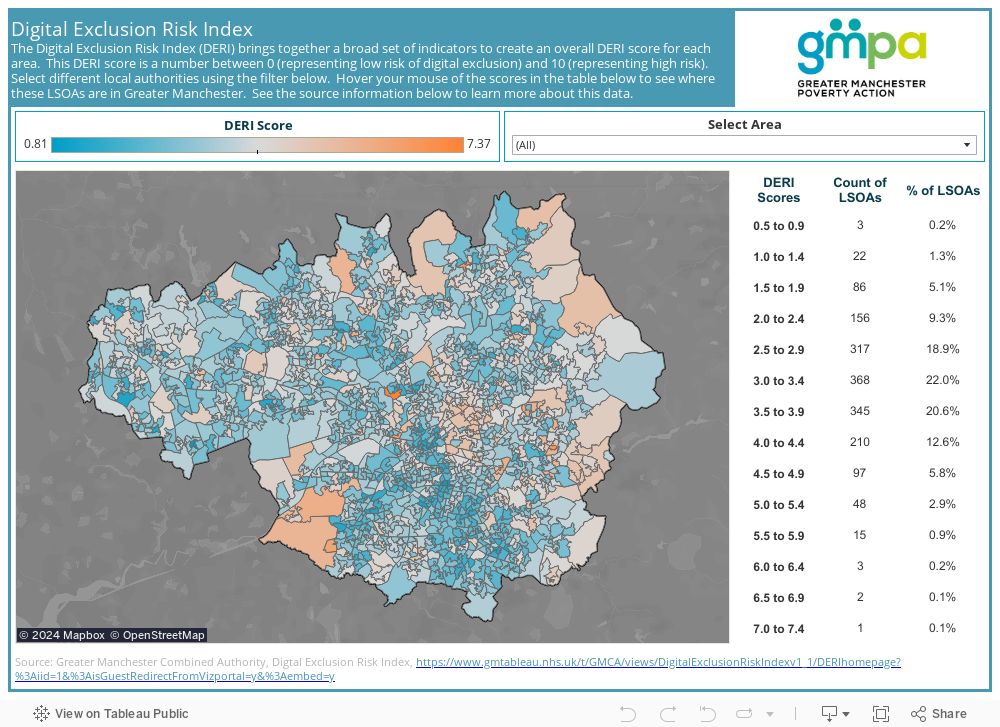
This map shows the Digital Exclusion Risk Index (DERI) score for each lower super output area (LSOA) area in Greater Manchester. It replicates a map developed by Greater Manchester Combined Authority, and we refer users to this page for information about what the map contains and how it can be interpreted.
We have provided additional data: Education attainment data breakdown by Greater Manchester Local authorities which you can download here.
Please click here to return to the GM Poverty Monitor 2022 main page and the list of sub pages
Poverty Monitor 2022: Education