
 Homelessness

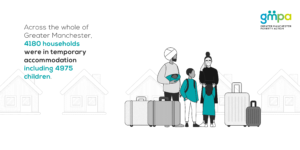
Homelessness and poverty are inextricably linked. There are a number of different classifications of homelessness. Visit the Crisis website to find out more.
This page details the numbers of households living in temporary accommodation in Greater Manchester and each of the city region’s ten boroughs, the number of rough sleepers across Greater Manchester and the number of homelessness duties in each area.
Want the latest poverty information, data, stories and news delivered straight to your inbox? Sign up to our fortnightly newsletter.
Homelessness duties
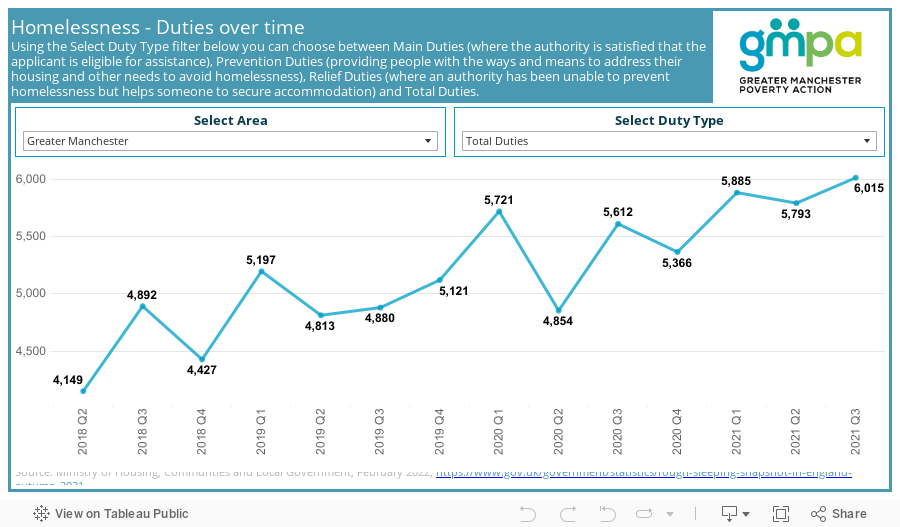
This chart shows homelessness duties overtime in each of Greater Manchester’s ten boroughs and across Greater Manchester as a whole. There are three homelessness duty types (detailed within the chart). Looking at this data gives a good indication of the scale and risk of homelessness in an area.
Duties have risen across Greater Manchester over the period shown in the chart, from 4,149 to 6,015. All boroughs, with the exception of Salford and Tameside, saw a higher number of duties in the third quarter of 2021 compared to the second quarter of 2018.
Rough sleeping
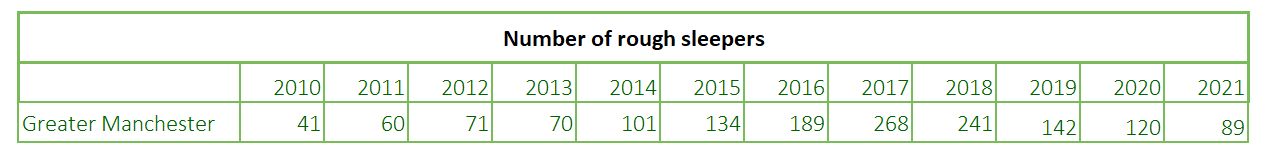
This table shows the number of people sleeping rough across the whole of Greater Manchester since 2010. The figures are based on a count of people sleeping rough carried out each autumn. Rough sleeping numbers rose considerably between 2010 and 2017. They have since fallen but remained well above the 2010 level in 2021.
You can read more about the way these statistics are collected here.
Temporary accommodation
This chart shows the number of people living in temporary accommodation in Greater Manchester and in each of the city region’s ten boroughs overtime.
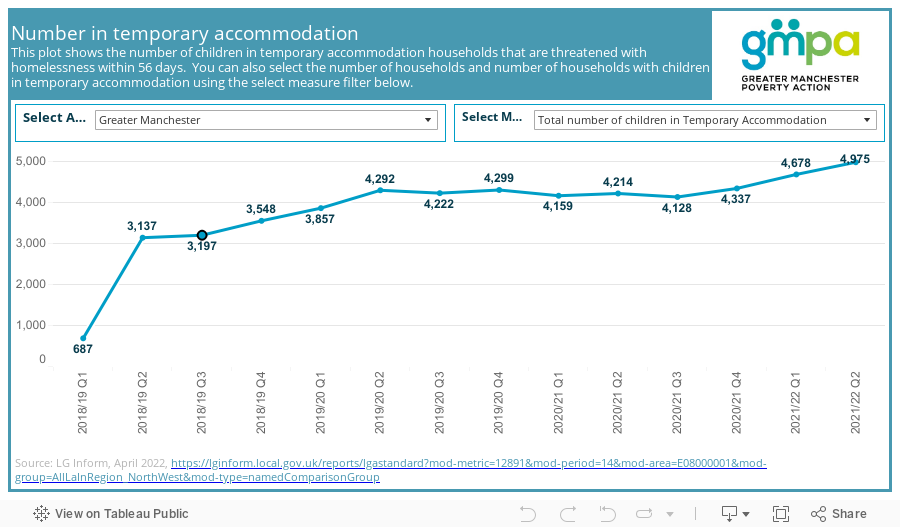
Where there are gaps within the data this is due to data not being received or incomplete data from local authorities.
Please click here to return to the GM Poverty Monitor 2022 main page and the list of sub pages
Poverty Monitor 2022: Homelessness