
 Housing
Over 260,00 households in Greater Manchester are in receipt of support for housing costs through either the housing element of Universal Credit or Housing Benefit. For many households, the support they receive towards their rent falls significantly short of the full amount they need. The cost of rent can account for a significant proportion of a household’s earnings.
Want the latest poverty information, data, stories and news delivered straight to your inbox? Sign up to our fortnightly newsletter.
Support with housing costs
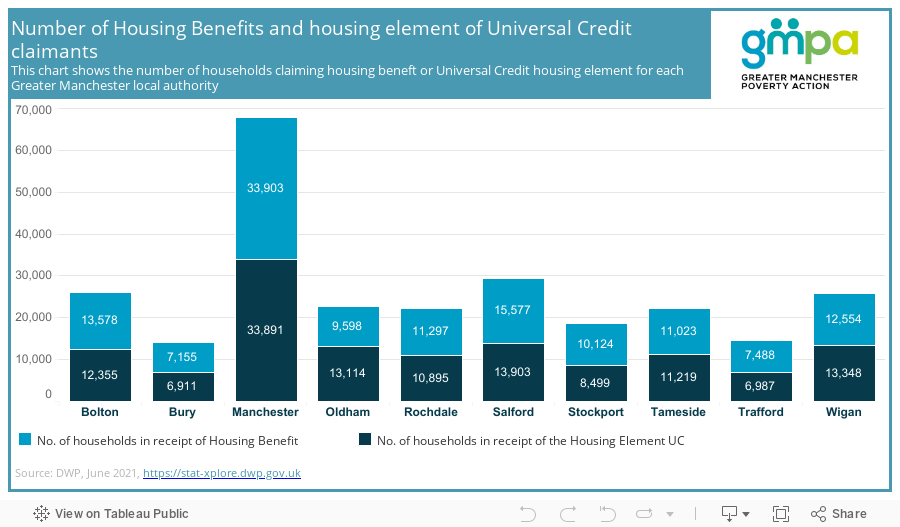
This chart shows the number of Housing Benefit (HB) claimants, and the number of households claiming the Housing Element of Universal Credit (UC), by local authority in June 2021. UC has been introduced to replace other welfare benefits, including HB – new claimants for welfare benefits now instead receive the housing element of UC to cover their rent. Therefore it is helpful to look at the figures for the two different benefits together to understand the total number of households in receipt of support.
Manchester had the highest numbers of households claiming both benefit types. The number of households claiming HB or the UC Housing Element in Manchester (67,794) was more than double that of the next highest local authority (Salford – 29,480). Bury had the lowest number of claimants of both types of benefit.
Local housing allowance values
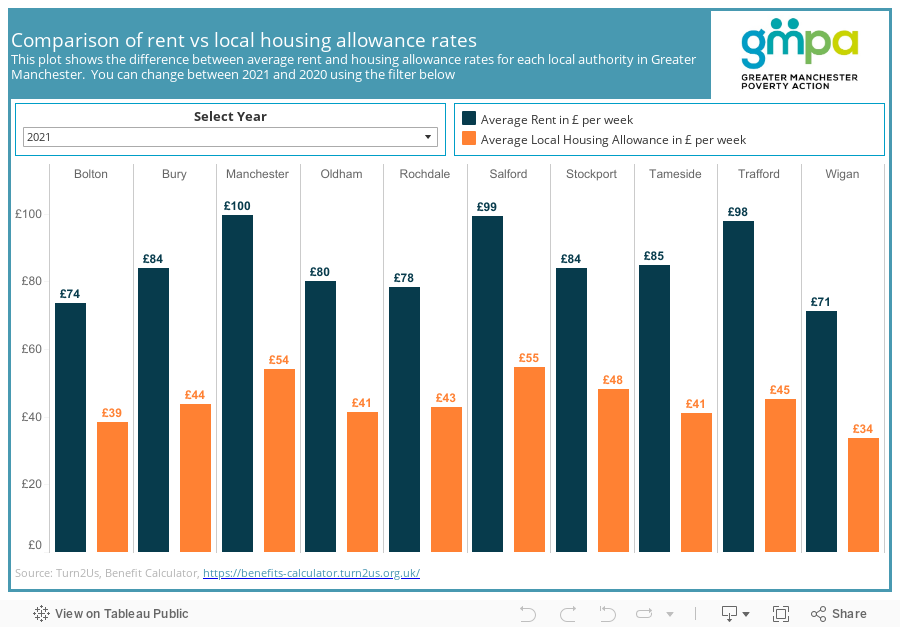
This chart shows the difference between average rent and local housing allowance (LHA) in each of Greater Manchester’s ten boroughs. LHA is significantly lower than average rents in all ten boroughs. The value of LHA to average rent in 2021 ranged from 45.92% to 57.14%. At £53 per week, Trafford is home to the largest differential between LHA and average weekly rent. Bolton and Rochdale (£35) have the lowest differential.
Rent and affordability
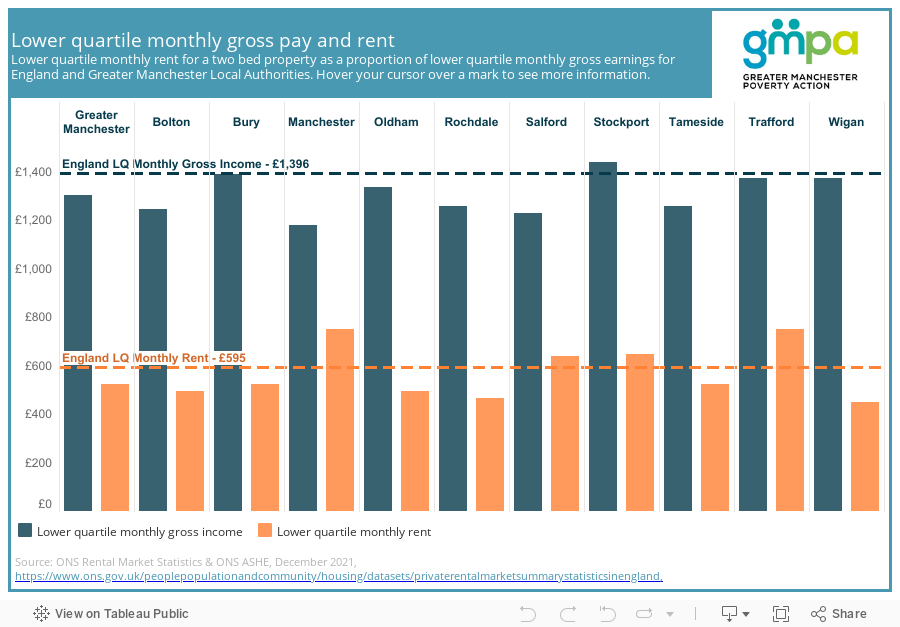
This chart shows the lower quartile rent for a two-bed apartment, and lower quartile monthly earnings in England, Greater Manchester and Greater Manchester’s ten boroughs in 2021. In Greater Manchester, rent takes up 40.2% of monthly gross income for people in the lower quartile, compared to 42.62% across England. This suggests rent for people on low incomes is slightly less affordable in Greater Manchester compared to England as a whole.
Across the ten boroughs, Manchester is the least affordable area with rent taking up 63.6% of gross monthly income. Wigan appears the most affordable, with rent costing 32.7% of gross monthly income.
Please click here to return to the GM Poverty Monitor 2022 main page and the list of sub pages
Poverty Monitor 2022: Housing