
 Index of Multiple Deprivation

The Index of Multiple Deprivation (IMD) combines information from seven domains to produce an overall relative measure of deprivation for small areas in England. The domains are: Income; Employment; Education; Skills and Training; Health and Disability; Crime; Barriers to Housing Services; Living Environment. The more deprived an area is, the higher the IMD score but the lower the rank. The IMD is published every four years and was most recently published in 2019.
Want the latest poverty information, data, stories and news delivered straight to your inbox? Sign up to our fortnightly newsletter.
Deprivation at a neighbourhood level
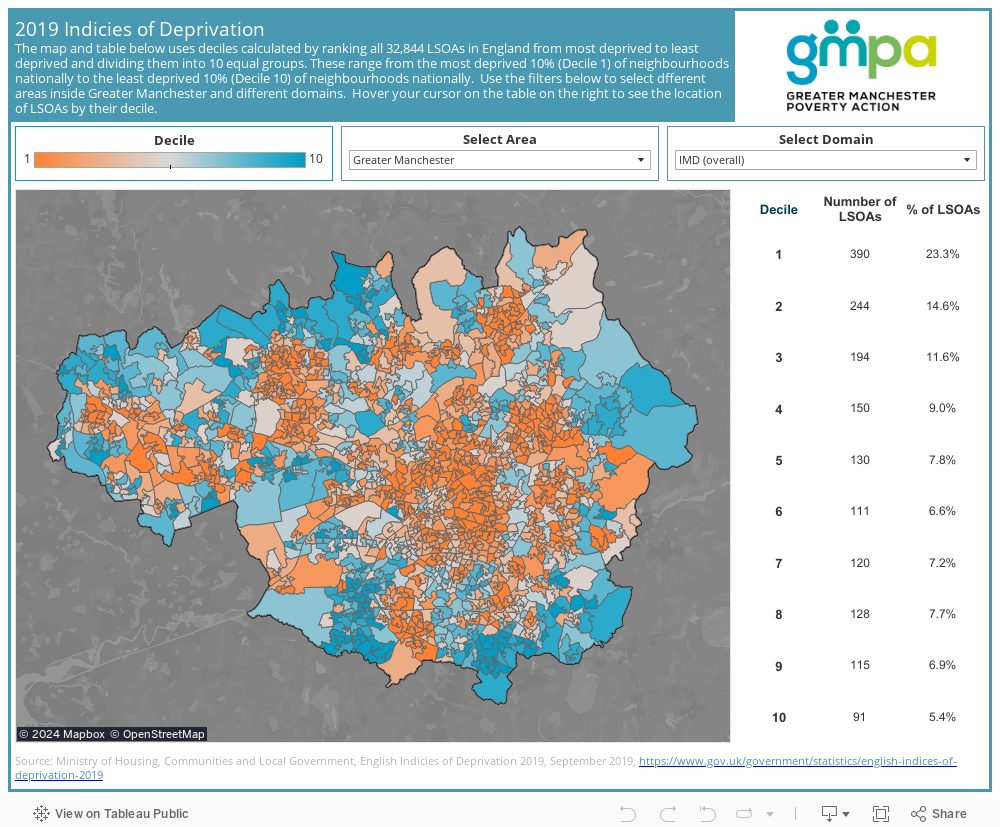
The IMD produces data for small geographic areas know as Lower Super Output Areas (LSOAs). The map below allows you to identify which decile each neighbourhood of Greater Manchester falls into (with decile 1 being the most deprived) for their overall deprivation score and for each IMD domain.
Ward level deprivation
LSOAs aren’t coterminous with electoral wards, but ‘best fit analysis’ can provide a deprivation score and ranking for electoral wards in England using IMD.
There are two subsets to the IMD. The Income Deprivation Affecting Children Index (IDACI) subset measures the proportion of all children aged 0 to 15 living in income deprived families. The Income Deprivation Affecting Older People Index (IDAOPI) subset measures the proportion of all those aged 60 or over who experience income deprivation.
You can download the IMD score, the average score by domain and the IDACI and IDAOPI scores for best-fit LSOAs in each electoral ward in Greater Manchester by clicking on the button below.

Please click here to return to the GM Poverty Monitor 2022 main page and the list of sub pages
Poverty Monitor 2022: Index of Multiple Deprivation