
 Labour market
Work is often seen as the best route out of poverty. However, around two thirds of working age adults and children experiencing poverty in the UK live in households where at least one person is in work. The rise of in-work poverty in the UK has been a growing trend and suggests that employment alone is often not an effective means of escaping poverty. Addressing low pay and supporting in-work progression is central to tackling in-work poverty. That’s why GMPA runs the Greater Manchester Living Wage Campaign. This page provides pay data for each of the city region’s ten boroughs.
Of course, the risk of poverty remains greater among those living in workless households. This page also details unemployment rates in each of Greater Manchester’s ten boroughs over time.
Want the latest poverty information, data, stories and news delivered straight to your inbox? Sign up to our fortnightly newsletter.
 People on National Living Wage (NLW)/ National Minimum Wage (NMW)
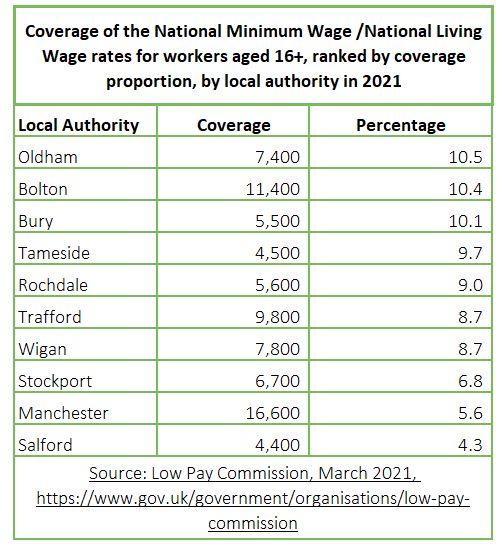
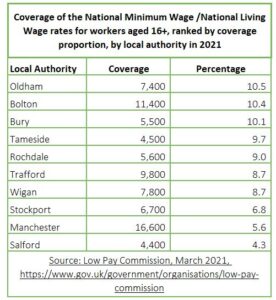
The table shows the number and proportion of workers aged 16+ earning the National Minimum Wage (NMW) or National Living Wage (NLW) in 2021 in each of Greater Manchester’s ten boroughs. It shows that Salford has the lowest proportion of workers earning the NMW or NLW at 4.3%, with Oldham having the highest proportion of workers earning the NMW or NLW at 10.5%.
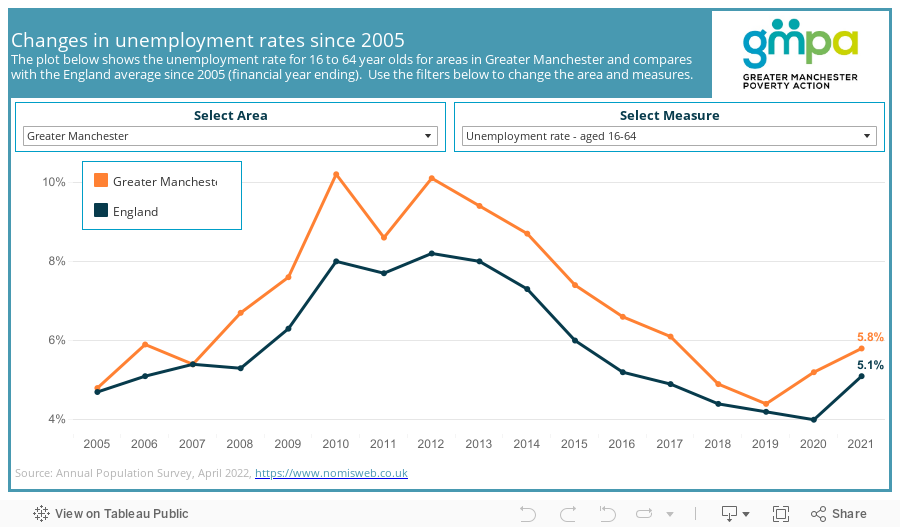
Unemployment rates
This chart shows the unemployment rate in those aged 16-64 between 2005 and 2021, by gender and by local authority and by Greater Manchester as a whole compared to England.
The unemployment rate in Greater Manchester has tended to be higher than the England rate. Whilst this gap did close prior to the pandemic, it has opened up again since. In 2021 there was a bigger unemployment rate gap between Greater Manchester and England for females (1.3%) than there was for males (0.2%).
Looking at individual boroughs, overtime unemployment rates have fluctuated more than across England as a whole. In 2021, four boroughs (Bolton, Salford, Tameside and Wigan) had unemployment rates below the England rate. All other boroughs had higher rates, with Manchester being home to the highest rate of unemployment (8.7%).
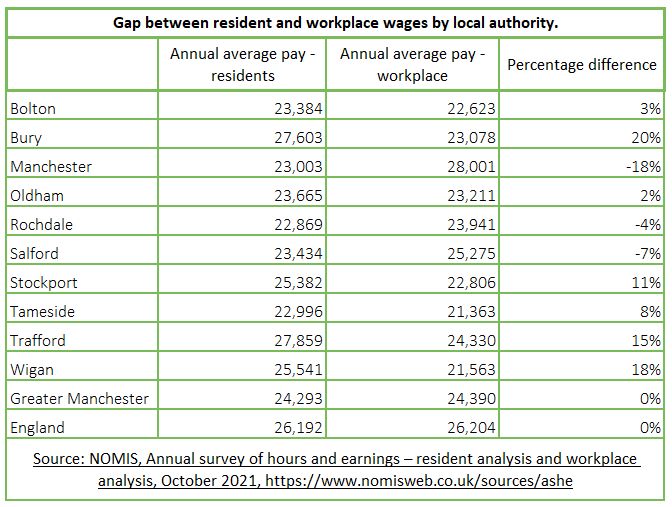
Annual average pay
This table shows annual average pay in England, Greater Manchester and across Greater Manchester’s ten local authorities for both workplace and resident earnings.
Average resident earnings in Trafford and Bury are higher than the England average and lower in the other eight boroughs. Manchester is the only borough in England where workplace earnings are higher than the England average.
Comparing resident and workplace earnings, people living in Bury and Wigan earn considerably more than jobs typically pay in their area.
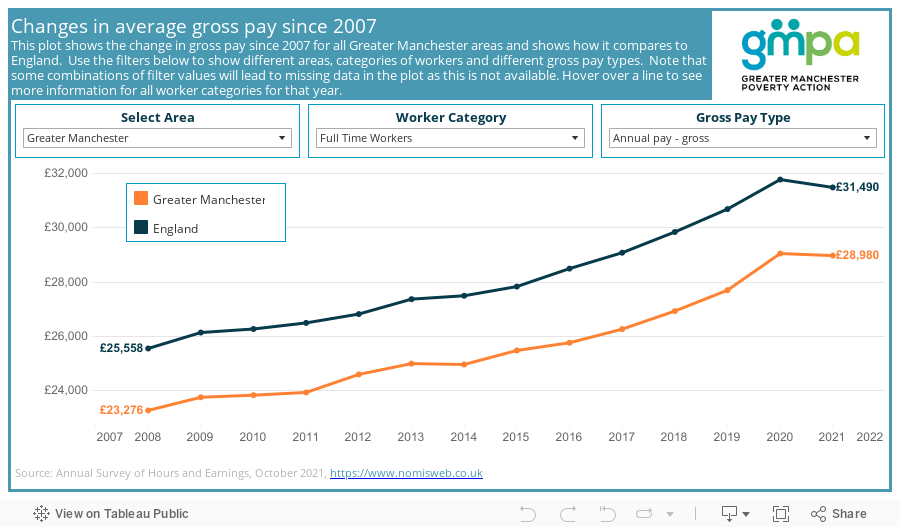
Changes in average gross pay
This chart shows changes in pay since 2007. In Greater Manchester, as in England, pay for fulltime workers grew overtime up until 2020, but has fallen recently.
Pay for part time workers has continued to rise across England as a whole, but has fallen recently in Greater Manchester.
The chart also shows annual gross pay across each of Greater Manchester’s ten boroughs broken down by working hours and gender.
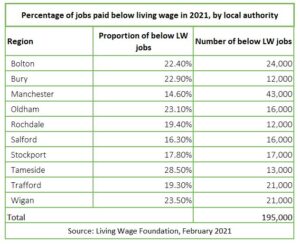 Jobs paid less than the Real Living Wage

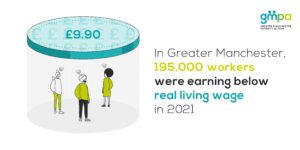
This table shows the proportion of jobs paid less than the Real Living Wage across Greater Manchester’s ten boroughs. The Real Living Wage is an independently calculated, voluntary hourly rate designed to meet actual living costs which is paid by over 10,000 UK employers. It is different from the government’s National Living Wage, which is a statutory minimum that applies to all UK employees aged 23 and over. The rate currently stands at £9.90 per hour. Tameside is home to the highest proportion of jobs paying less than the real living wage (28.5%) and Manchester the lowest (14.6%).
Across the whole of Greater Manchester there are 195,000 jobs paying less than the Real Living Wage.
Visit the Living Wage Foundation website to find out more about the Real Living Wage, and the Greater Manchester Living Wage Campaign to find out more about GMPA’s work on this issue.
 The economic benefits of paying the Real Living Wage
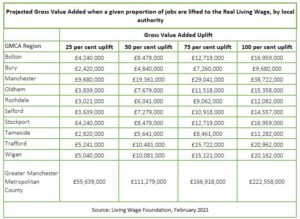
This table shows the economic benefit (as measured by ‘gross value added’ of increasing the number of jobs paying the Real Living Wage.
Increased payment of the Real Living Wage has a ‘multiplier’ effect when it comes to economic growth, resulting in increased productivity, greater localised spending and increased tax revenues.
If all jobs currently paid less than the Real Living Wage in Greater Manchester were lifted to the Real Living Wage level the gross value added benefit to the city region would be £228,550,000.
For more information, see this report: ‘The Living Wage Dividend: Maximising the local economic benefits of paying a living wage’.
Please click here to return to the GM Poverty Monitor 2022 main page and the list of sub pages
Poverty Monitor 2022: Labour market