
 Social security

Updated February 2024 with new figures on Free School Meal eligibility
Social security data shows us how many people in an area are in receipt of certain benefits. During the pandemic, more and more people sought support through the social security system in the UK, and this has been true here in Greater Manchester. This is best illustrated through the Universal Credit claimant data detailed on this page, with the number of claimants increasing in all ten boroughs at the onset of the pandemic.
This page provides data at a Greater Manchester level and at a borough level. Whilst most benefits are administered by central government, councils are responsible for Council Tax Support and not-for-profit organisations are stepping in to support people. Therefore, this page details Council Tax Support data and data on grants provision from the charity Turn2Us.
Want the latest poverty information, data, stories and news delivered straight to your inbox? Sign up to our fortnightly newsletter.
Free School Meals
Using administrative education data and local poverty estimates, this chart shows the breakdown, by local authority (LA), of children in poverty not eligible for free school meals (FSM). The analysis shows that every Greater Manchester LA has thousands of children in poverty who miss out, ranging from 3,000 in Bury and Stockport to 10,500 in Manchester.
Universal Credit deductions
This data shows the number of children living in households claiming Universal Credit who are affected by deductions, by parliamentary constituency.
This data has been provided by the Department for Work and Pensions in answers to written parliamentary questions tabled by Stockton North MP, Alex Cunningham, and shared with us by the North East Child Poverty Commission.
Deductions can be taken from a family’s Universal Credit entitlement for a range of debts, including to utility companies, but most commonly they are for the repayment of a Universal Credit ‘advance’ – a loan which many families take out from the Government during the five-week wait for their first Universal Credit payment.
Take a look at the maps to see: the number of children in Universal Credit households with a deduction in each constituency; the percentage of children in households receiving Universal Credit affected by deductions in each constituency; and the total monthly amount (£) deducted from households with children receiving Universal Credit in each constituency.
To see the full data for each constituency in the North West region, click here.
Universal Credit claimants
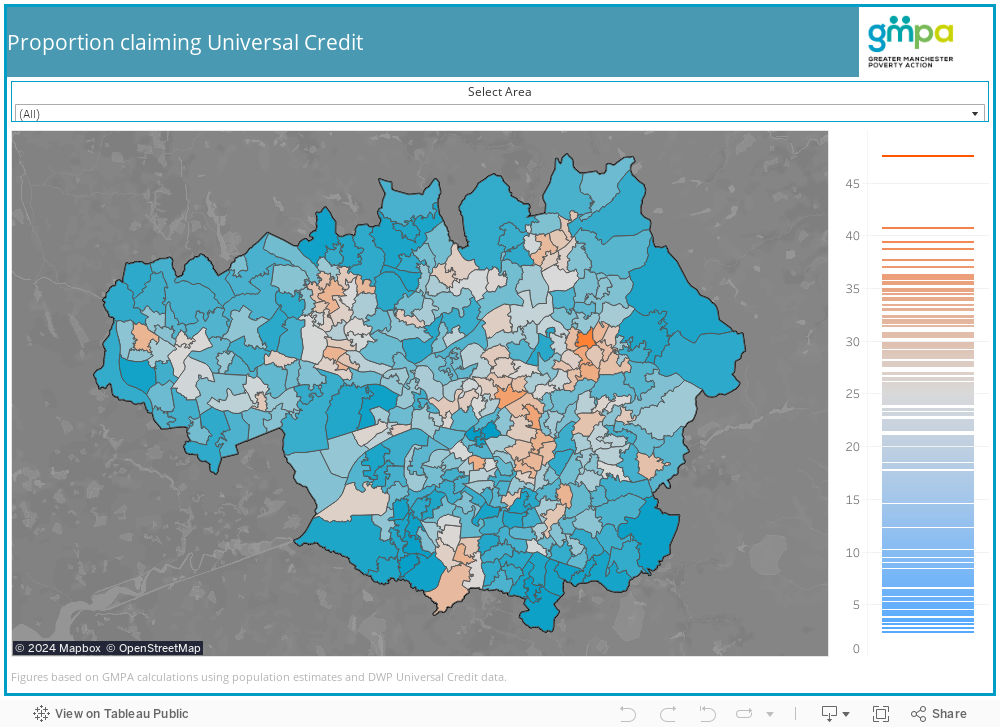
This map estimates the percentage of people claiming Universal Credit by Middle Super Output Area (MSOA) based on Universal Credit claimant data from February 2022.
Universal Credit is the main working age benefit for people out-of-work and people in low paid employment. A high proportion of claimants in an area suggests a high number of low income, working-age households.
The orange and red areas are those with higher Universal Credit claimant rates. Use your cursor to identify the claimant rate for the area/s you are interested in.
The estimates are GMPA calculations based on DWP claimant data and ONS population estimates.
Council Tax Support recipients
This map estimates the proportion of residents in receipt of Council Tax Support by ward in eight out of ten Greater Manchester boroughs (comparable data for Salford and Stockport wasn’t available at the time of publication). This is based on the number of claimants in each borough in December 2021.
Council Tax Support provides help for people on low incomes with their Council Tax bill. The exact nature of support differs from one local authority area to the next.
The data presented on the map uses Council Tax Support numbers by ward provided by each local authority and ONS population estimates to estimate the proportion of recipients in an area. Use your cursor to identify the claimant rate for the area/s you are interested in.

Pension Credit
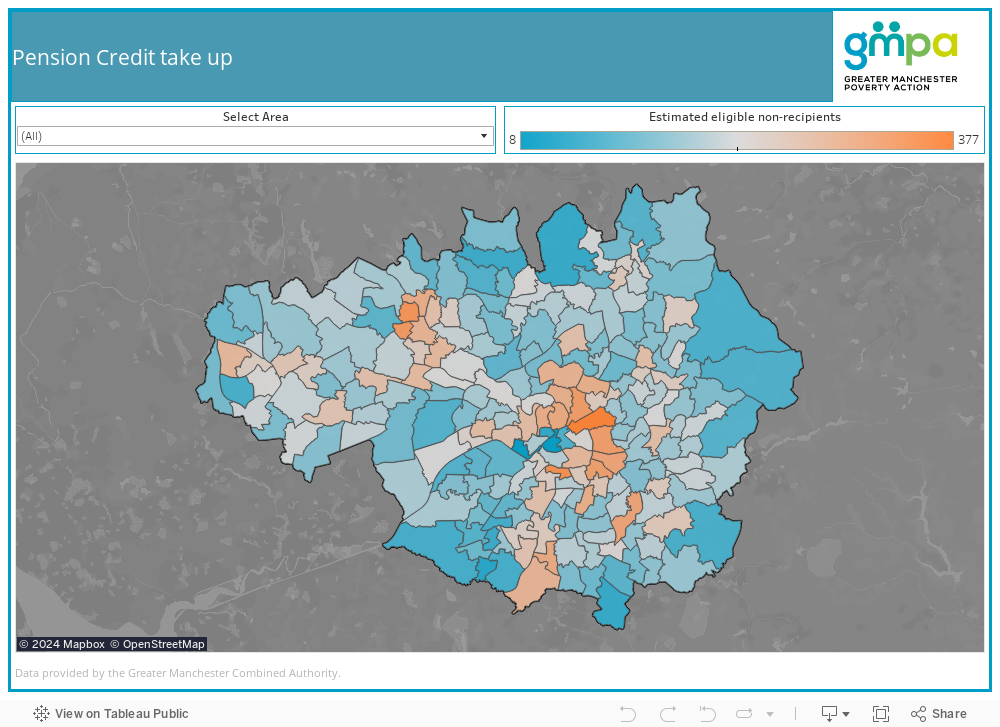
This map shows the estimated number of people eligible for, but not claiming Pension Credit in each ward in Greater Manchester. It also shows the total annual value of non-take up by ward (i.e. the total monetary value of Pension Credit not being claimed by eligible non-claimants in each area).
Use your cursor to identify the claimant rate for the area/s you are interested in. The data was provided by the Greater Manchester Combined Authority.
Out of work claimants
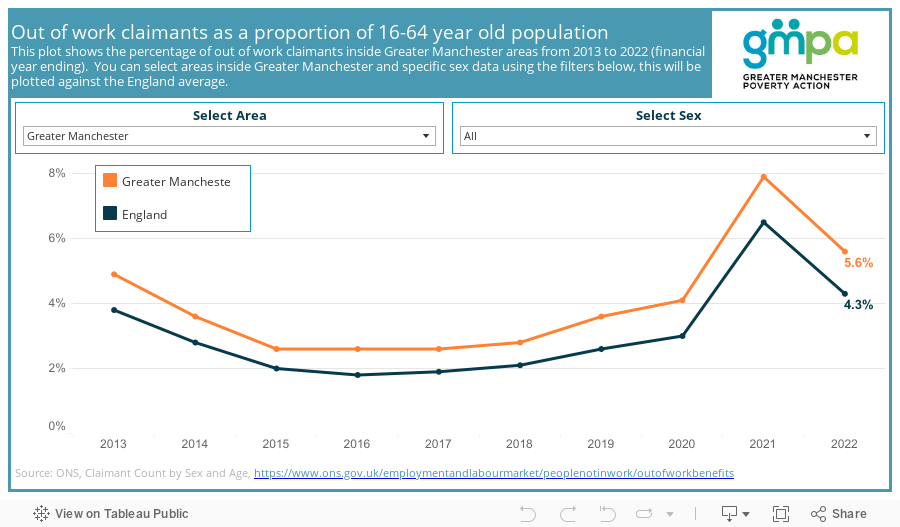
This chart shows the proportion of people claiming out of work benefits overtime and illustrates how claimants rates in Greater Manchester are consistently higher than the national average. The proportion of out of work claimants rose in both England and Greater Manchester at the onset of the pandemic, and has fallen since (this is true for all people and when broken down by gender).
Looking at individual boroughs, Oldham has the highest out of work claimant rate at 8.6%, following by Rochdale at 8.1%. Most boroughs in Greater Manchester tend to have a higher out of work claimant rate than the national average. However, Trafford has had a consistently lower rate and the rates in Stockport and Wigan are close to the national average.
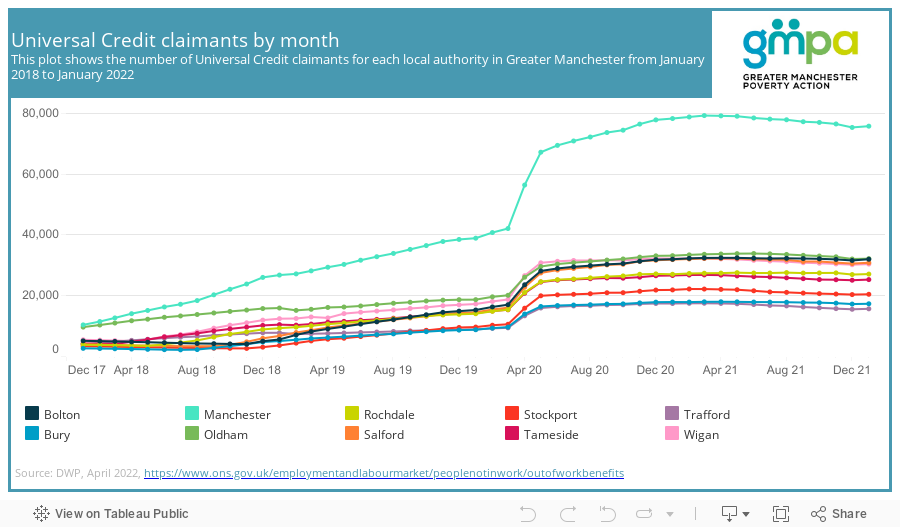
Universal Credit claimants
This chart displays how the number of Universal Credit claimants across Greater Manchester has changed over time on a monthly basis from January 2018. In March 2020, the number of Universal Credit claimants rose sharply across all area in Greater Manchester and typically continued to increase over the next 12 months. Since then the number of claimants has levelled off or decreased in most areas.
Please note that variance between Local Authority areas cannot be interpreted from the counts displayed here without first accounting for the population within each area.
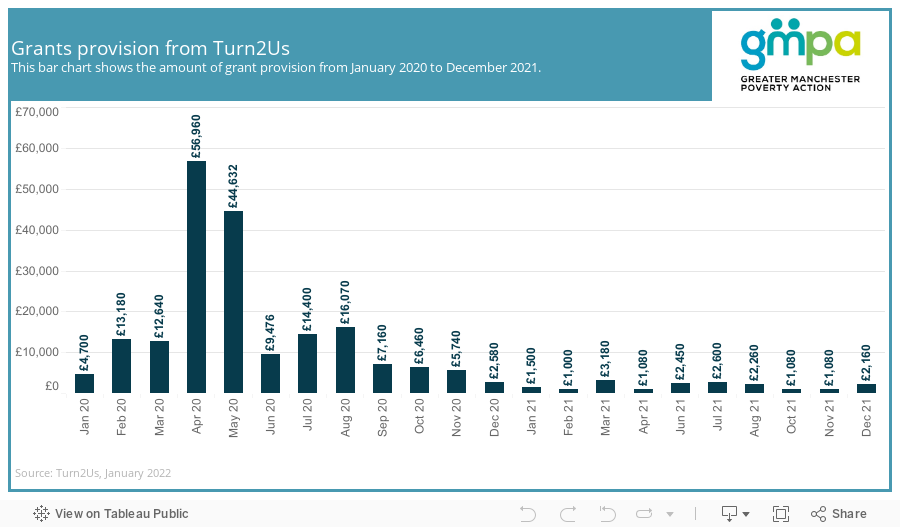
Grants provision from Turn2Us
The charity Turn2Us provide grants to people facing financial hardship. This chart shows grants issued by Turn2Us to recipients living in Greater Manchester since January 2020. To find out more about the support they provide click here.
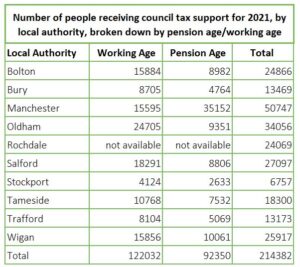 Council Tax Support
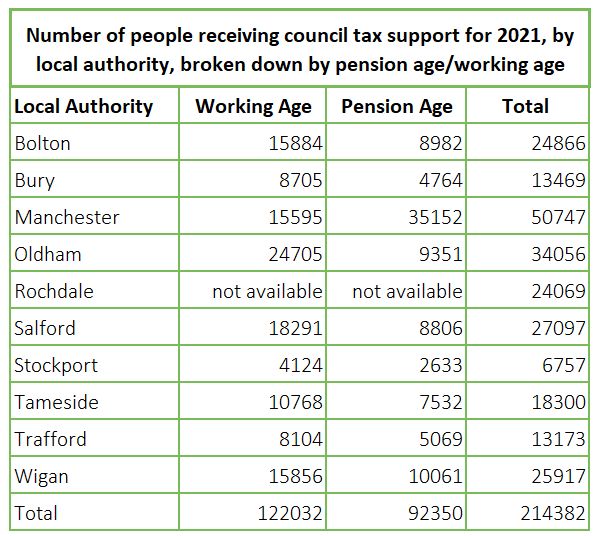
Since 2013, councils have been responsible for providing Council Tax Support to residents. The level of support and eligibility criteria varies from one council to the next. To find out more about Council Tax Support click here.
This table shows the number of people receiving Council Tax Support in each Greater Manchester borough in 2021, broken down by working age and pension age. There were 214,382 people receiving Council Tax Support across the whole of Greater Manchester in 2021.
Please note that variance between Local Authority areas cannot be interpreted from the counts displayed here without first accounting for the population within each area.
Support with housing costs
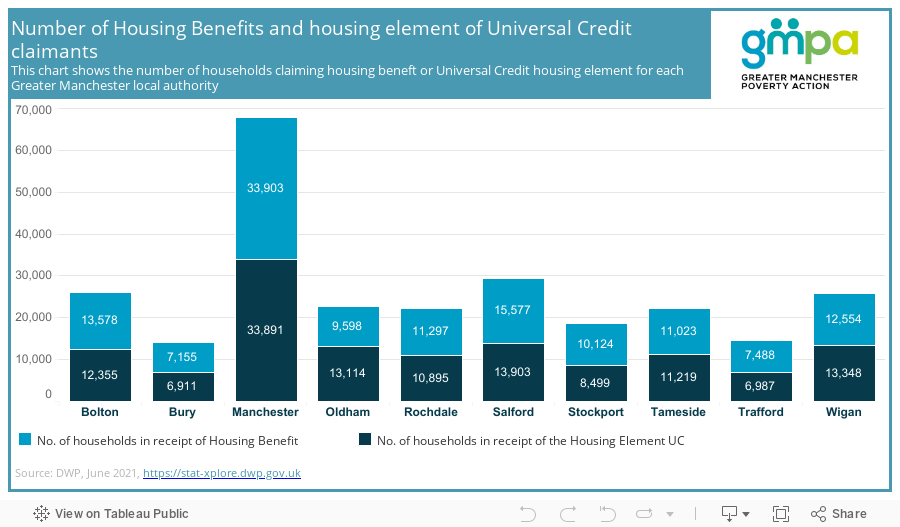
This chart shows the number of Housing Benefit (HB) claimants, and the number of households claiming the Housing Element of Universal Credit (UC), by local authority in June 2021. UC has been introduced to replace other welfare benefits, including HB- new claimants for welfare benefits now instead receive the housing element of UC to cover their rent. It is therefore helpful to look at the figures for the two different benefits together to understand the total number of households in receipt of support.
Manchester had the highest numbers of households claiming both benefit types. The number of households claiming HB or the UC Housing Element in Manchester (67,794) was more than double that of the next highest local authority (Salford – 29,480). Bury had the lowest number of claimants of both types of benefit.
Please click here to return to the GM Poverty Monitor 2022 main page and the list of sub pages