
 Fuel, utilities and food
Added August 2022: Food insecurity data by LSOA.
Many households experiencing poverty struggle to afford essential living costs, including fuel and food. Fuel and food insecurity data are detailed on this page. This data is complemented by service user data from the Trussell Trust (no. of food parcels distributed) and United Utilities (proportion of people in each Greater Manchester borough accessing financial support from United Utilities).
GMPA believes in a ‘cash first’ approach to poverty that prioritises giving people money over in-kind support such as food parcels and energy vouchers. You can read more about this approach here.
Want the latest poverty information, data, stories and news delivered straight to your inbox? Sign up to our fortnightly newsletter.
Fuel insecurity by local authority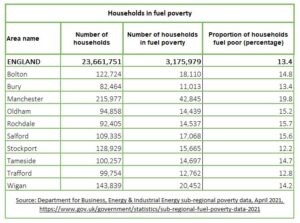
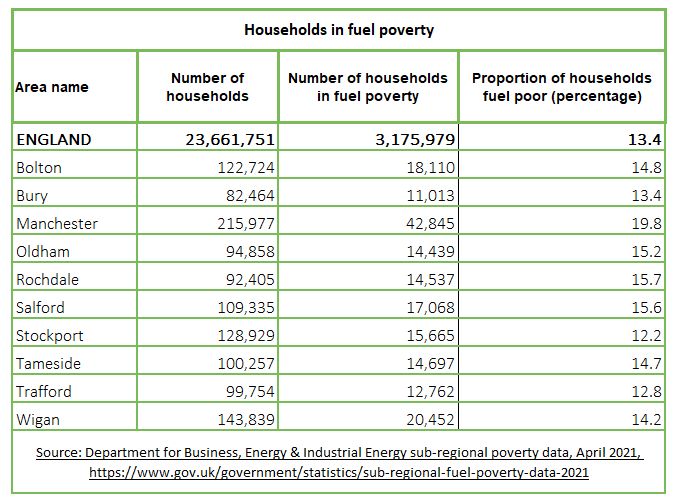
This table shows the proportion of households that are fuel poor in each of Greater Manchester’s ten boroughs.
Manchester has the highest proportion of households classed at fuel poor (19.8%). Fuel poverty is a problem in all areas, with seven out of ten boroughs having a higher fuel poverty rate than the England average (13.4%).
There are 3 important elements in determining whether a household is fuel poor: household income, household energy requirements and fuel prices. You can find out more about the definition of fuel poverty here.
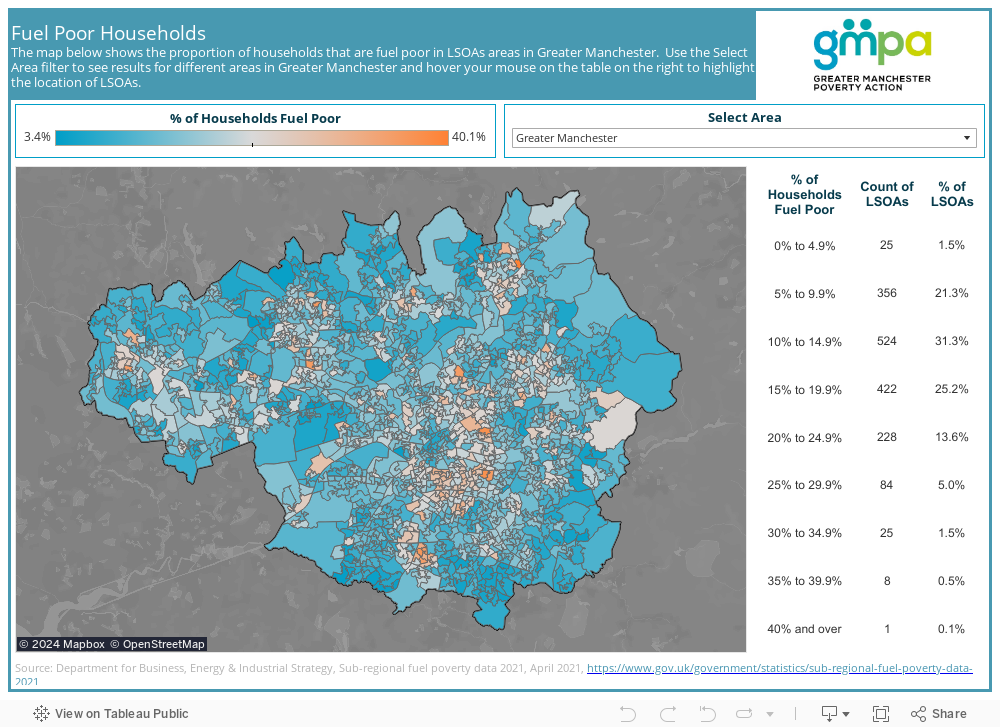
Fuel insecurity by lower super output area
This map shows the proportion of households that are fuel poor in each lower super output area (LSOA) in Greater Manchester. Across the whole of the city region, at least one in ten households are fuel poor in 77% of LSOAs.
The map allows you to look at individual local authority areas in isolation. Looking at Bolton, at least one in four households are fuel poor in thirteen lower super output areas.
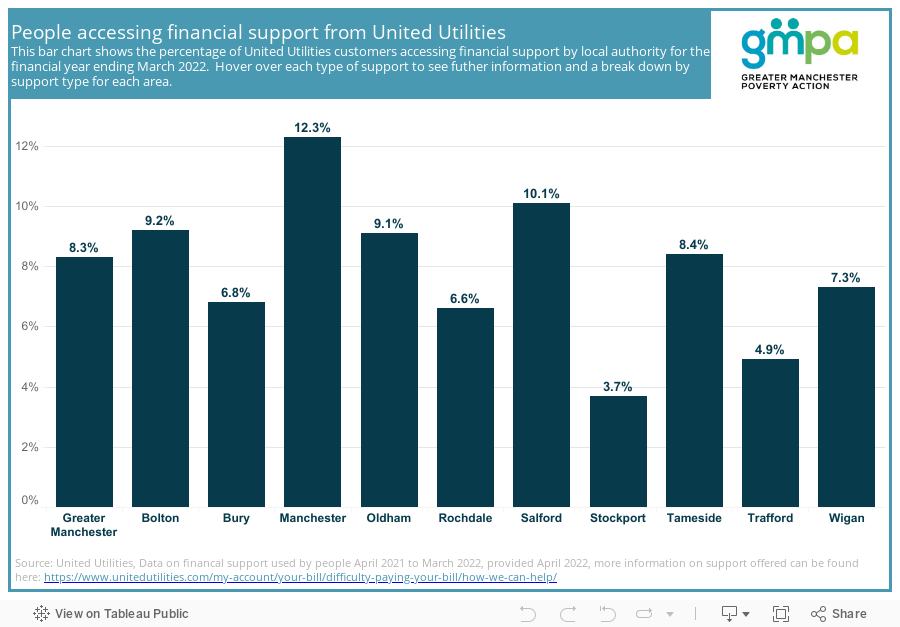
People accessing support from United Utilities
United Utilities (UU) have a number of different schemes for people who are struggling to pay their water bill. The chart below shows the proportion of UU customers accessing financial support in each of Greater Manchester’s ten boroughs. Manchester, Salford and Bolton are home to the highest proportion of UU customers accessing financial support.
The chart breaks down the type of support being provided in each borough. In all ten boroughs, the Back on Track scheme is the most common type of support. To find out more about the different types of support available to customers visit the UU website.
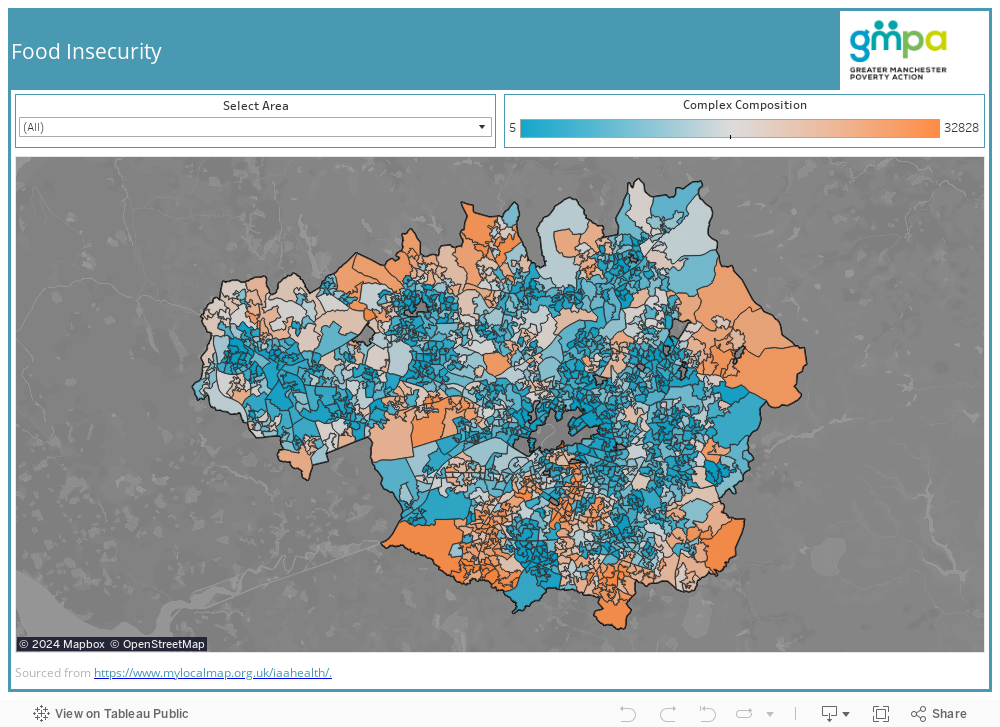
Food insecurity risk by LSOA
This map shows food insecurity risk by lower super output area (LSOA). This is based on ranking data published by the University of Southampton. This multi-dimensional index estimates the relative rank of food insecurity risk across local neighbourhoods in England. This map shows the ranking for each area in Greater Manchester. There are 32,844 LSOA in England in total. The lower the number the higher the risk of food insecurity.
For more details about the methodology behind this map please visit the University of Southampton website.
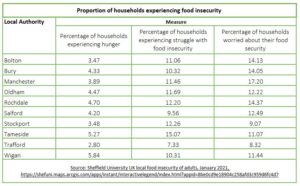 Food insecurity by local authority
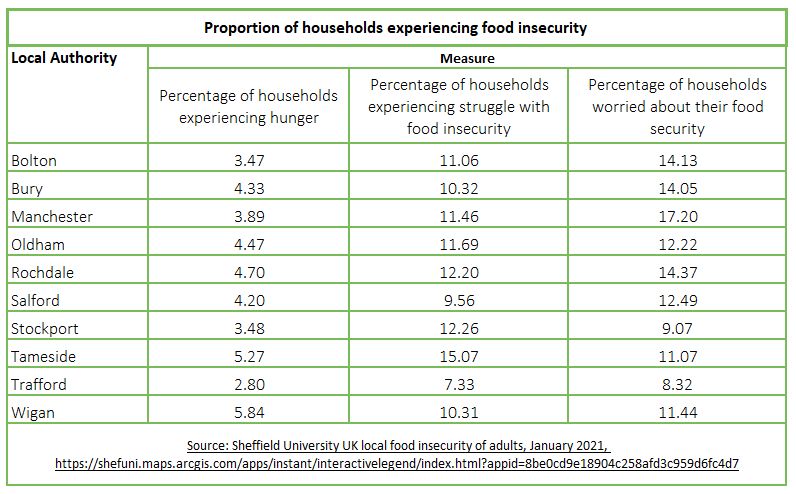
This table shows the proportion of households experiencing food insecurity using three breakdowns of food insecurity developed by Sheffield University.
More than one in twenty households in two Greater Manchester boroughs (Tameside and Wigan) are experiencing hunger. In all but two of Greater Manchester’s boroughs (Stockport and Trafford), more than one in ten households are struggling with food insecurity.
Manchester (17.2%) has the highest proportion of households that are worried about food security.
Food parcel distribution
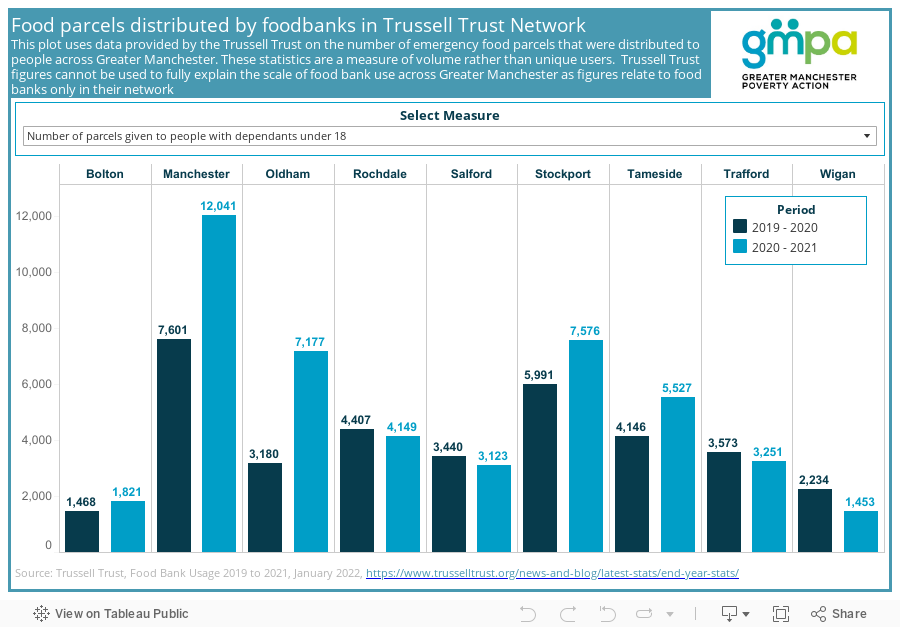
There has been a large rise in the number of foodbanks operating in the UK over the last decade. This rise has been driven by an increase in hardship, as a growing number of households have found it difficult to meet basic household needs. This chart shows the total number of food parcels distributed by the Trussell Trust foodbanks in the nine Greater Manchester boroughs they operate in in 2019/20 and 2020/21.
The differences between boroughs are a reflection of need, level of provision and population size. For more information about what drives foodbank usage and to help put the figures presented here into context, please visit the Trussell Trust website.
Food aid providers in Greater Manchester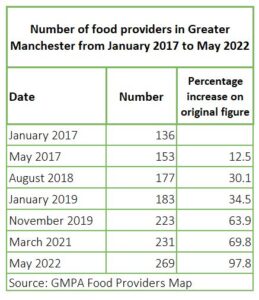
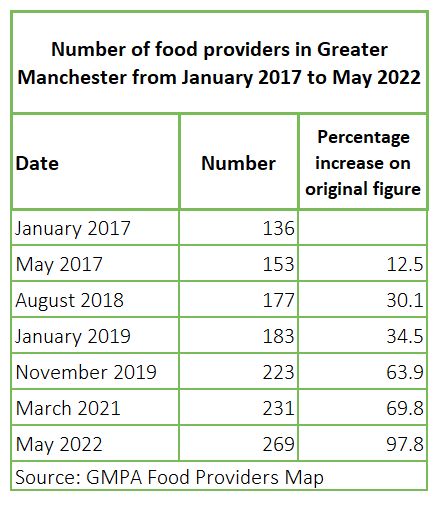
In January 2017 GMPA began mapping food providers within Greater Manchester. The following table shows the growth in their number over the following five years. Of the 269 now mapped 145 are foodbanks, 93 are pantries or food clubs and 31 are places that are able to provide meals.
To find out more about the food providers mapped please visit this page of our website. The map has proved to be a valuable resource and has received almost 90,000 hits.
Please click here to return to the GM Poverty Monitor 2022 main page and the list of sub pages
Poverty Monitor 2022: Fuel, utilities and food