By Rachel Walters, Coordinator at the End Child Poverty Coalition
On 5 June, Loughborough University and the End Child Poverty Coalition – of which Greater Manchester Poverty Action is a member – published the latest local child poverty statistics.
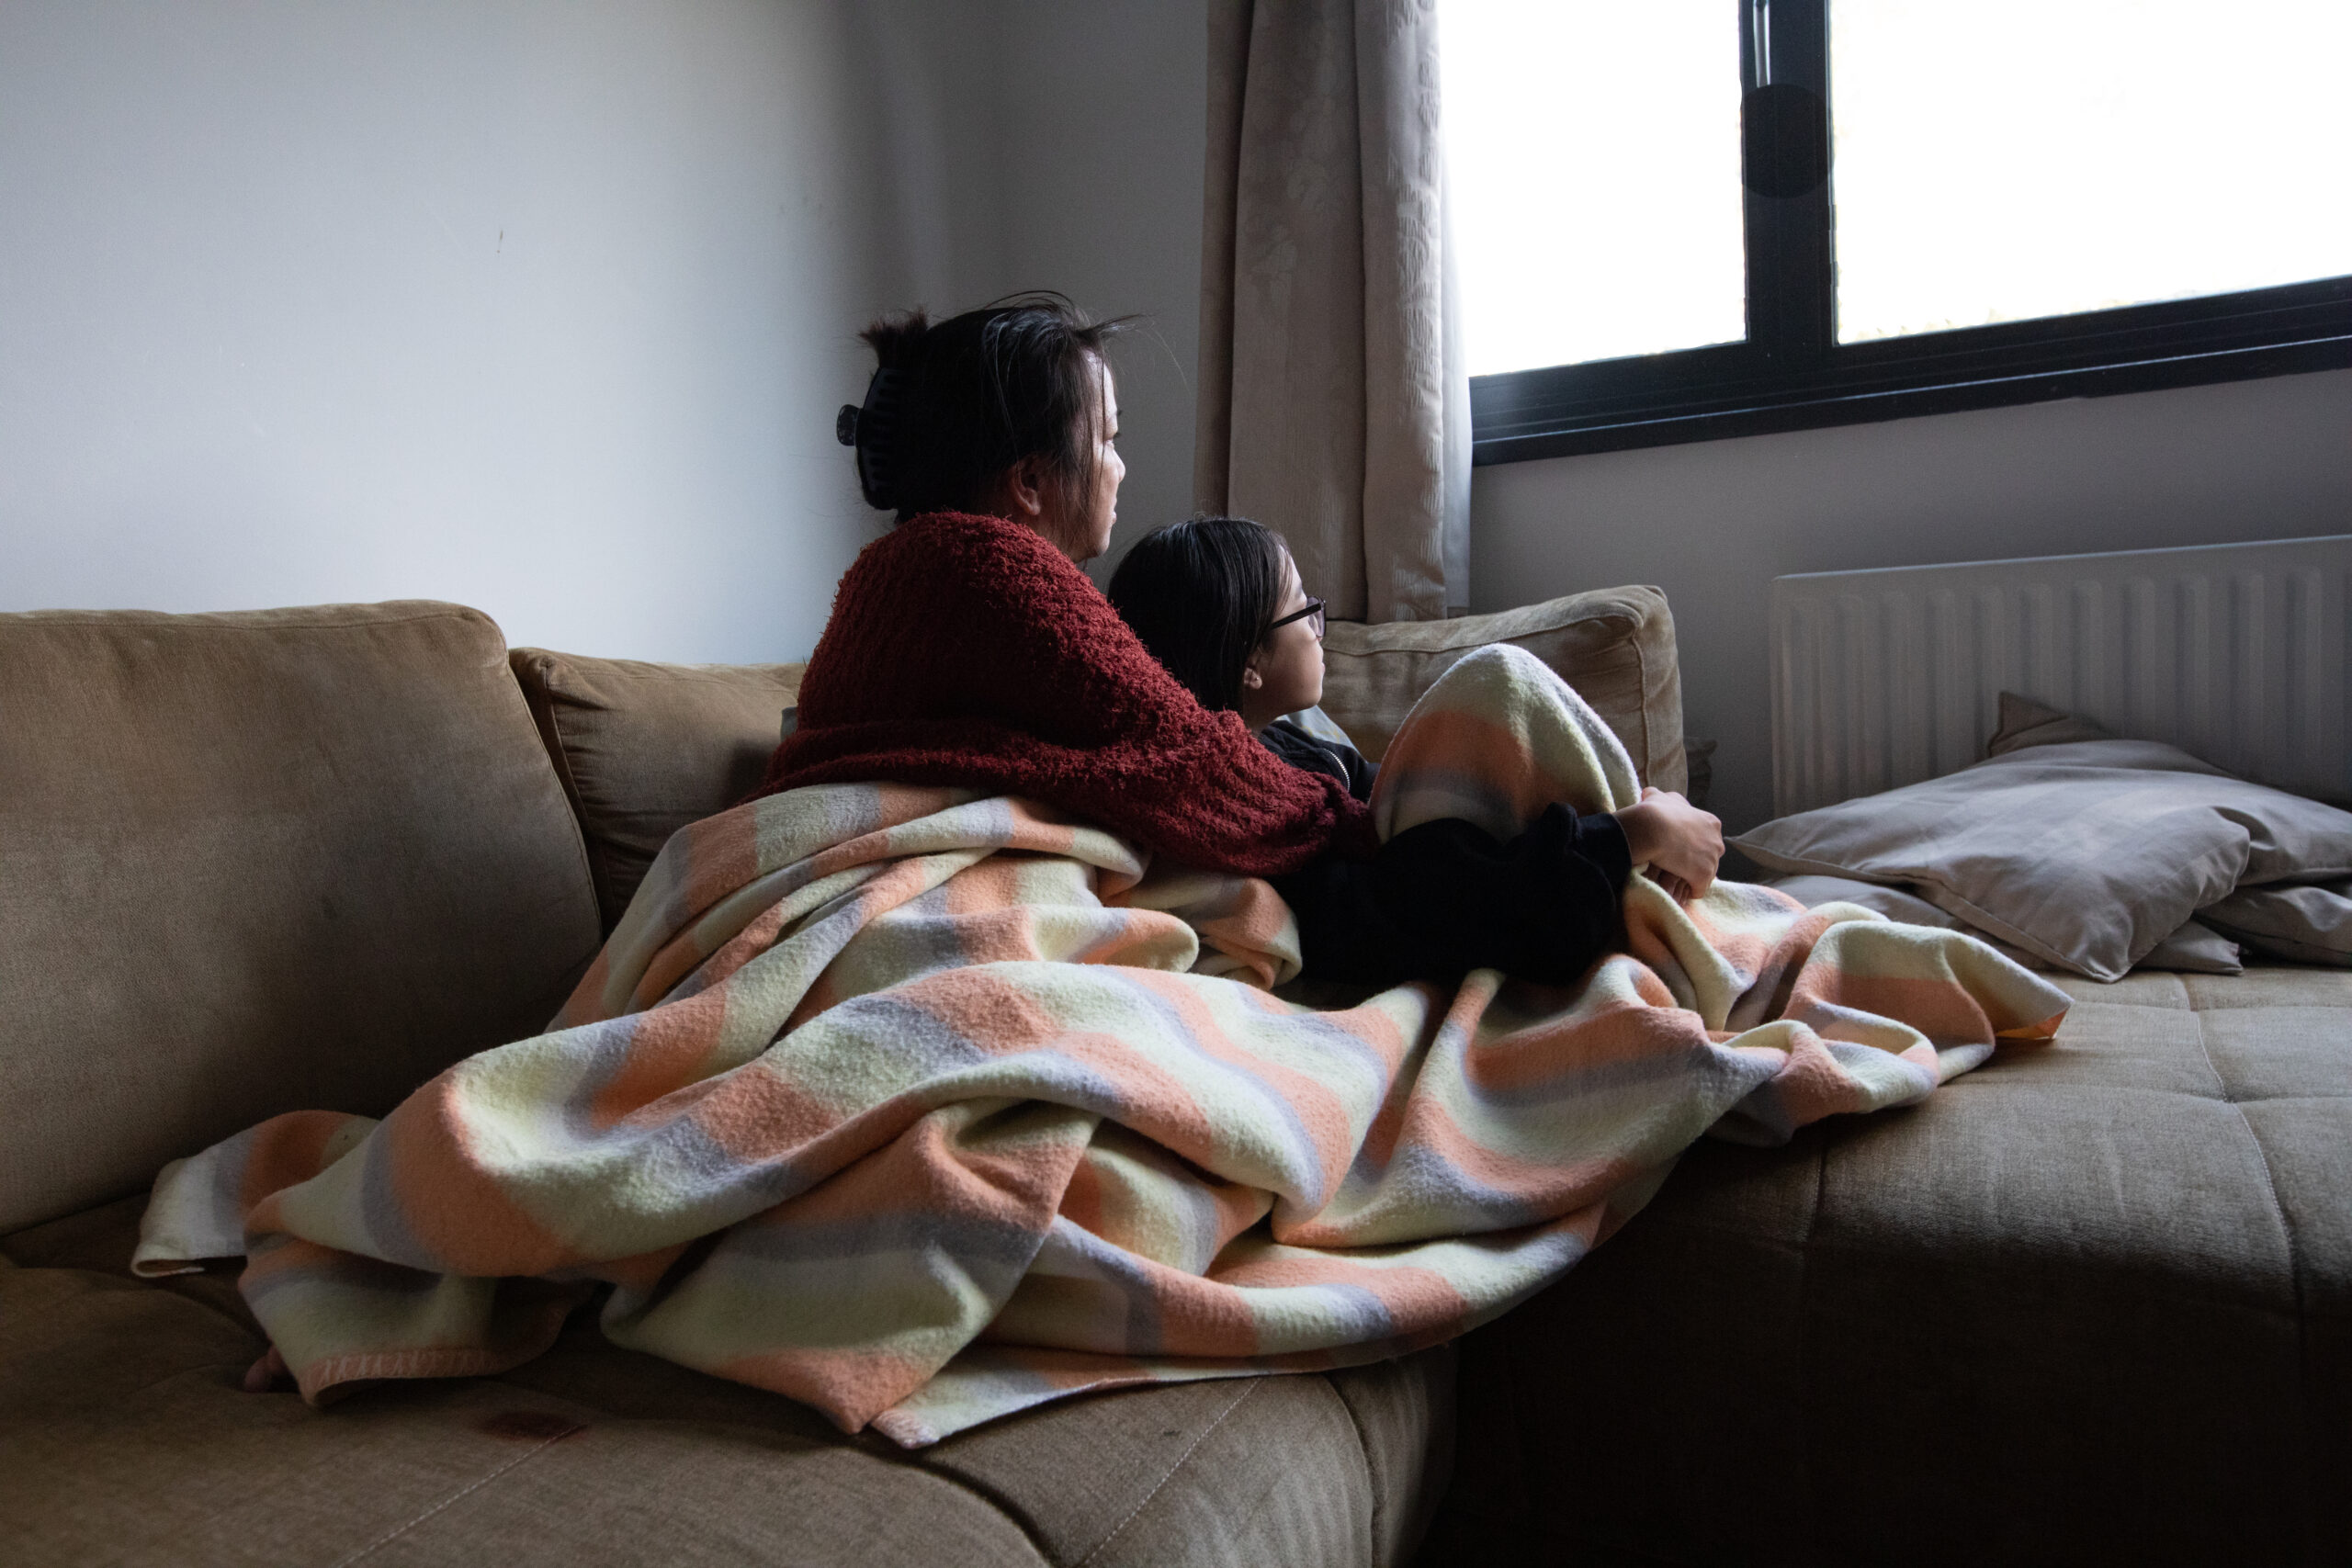
This research takes a closer look at child poverty levels in each local authority and Westminster constituency across the UK. Whilst the government produce national figures for child poverty, this research allows us to look at changes at a local and regional level. 
Researchers at Loughborough University use government data to calculate these figures, alongside information on local rent levels – meaning these figures are ‘after housing costs’ and take into account the income available to a family once rent, water rates, mortgage interest payments, insurance payments, ground rent and service charges are paid. This gives us a more accurate comparison of what households across the UK have available to spend on things like food, utilities, clothing and leisure, than looking at income alone, given the difference in rents across different parts of the UK.
Sadly, the results from this year’s research are shocking; for example, Birmingham constituencies have the highest levels of child poverty for any Westminster constituency – with child poverty in Birmingham Ladywood at 54.6%.
The government data which is used for this research is always a year old, meaning this year’s figures cover 2021/22, which is just six months into the cost-of-living crisis. It won’t be until next year that we see the true impact soaring living costs has had.
This years’ research not only looks as where levels of child poverty are the highest, but also which family types are most likely to experience poverty. We found that:
- 71% of children who were in poverty, after the cost of housing is taken into account, were living in a family where at least one adult was working.
- 44% of children in lone parent families are in poverty, after the cost of housing is taken into account. This is compared with just 25% of children in couple parent families.
- The poverty rate for children in families with three or more children was 42%, compared with 23% and 22% among children in families with one or two children.
- Children living in a family where someone is disabled had a poverty rate of 36% after housing costs were factored in, compared with 25% for children living in families where no-one is disabled.
- 47% of children in Asian or Asian British households and 53% of those in Black households were in poverty after housing costs, compared with just 25% of those where the head of household was White.
High levels of child poverty shouldn’t be tolerated by decision makers, and we know that decisions made by MPs have the ability to change children’s lives. The Coalition is calling on the UK government to scrap the two-child limit to benefit payments as this is the most cost-effective way of reducing child poverty. Getting rid of this policy would immediately lift 250,000 children out of poverty.
Please take action, emailing your MP today – letting them know that you want change for the 4.2 million children who live in a low-income family in the UK.
The End Child Poverty Coalition is made up of over 101 organisations including child welfare groups, social justice groups, faith groups, trade unions and others. Together with a group of 18 Youth Ambassadors we all believe that no child in the UK should live in poverty. We ask that this and future governments, commit to end child poverty.
For more articles like this straight to your inbox, sign up to our newsletter.
